Historically, the higher education system in countries belonging to the Organization for Economic Cooperation and Developing (OECD), a grouping of advanced economies, and especially in the United States, has been a magnet for foreign students, both graduate and undergraduates. Graduate students tend to be supported by teaching and research assistantships from the hosting university and do not generate direct revenues for the hosting institution. They do contribute to the economy with their productivity in research projects and with their private consumption. In contrast, most undergraduate foreign students pay fees and tuition which are often higher than those paid by local domestic students. The difference between out-of-state and in-state tuition and fees captures the “price” differential between local domestic students and their foreign counterparts. The latter undergraduate group generates foreign exchange revenues for the country in which the hosting institutions are located. These revenues constitute export revenues although the export is “consumed” in the hosting countries, unlike corn exports consumed at destination in the importing market. Foreign students in OECD countries come predominantly from Asian countries. This discussion abstracts from interstate trade which occurs when a university student from a given state studies in another state. Here, we only consider foreign buyers of U.S. education services.
The supply and demand of education
Export supply can be thought of as the difference between domestic supply and domestic demand or excess supply, say, a number of seats or slots for students. Most universities in OECD countries, including the US, have excess supply of higher education services and sell these to foreign costumers, i.e., foreign undergraduate students or their parents purchasing education services to educate their children. The supply of higher education services tends to vary little from year to year as classrooms, faculty members, etc. tend to stay the same in the short term. A decrease in domestic consumption (fewer domestic students) in any given year translates into more potential seats for foreign students. Universities within and across high-income countries compete to attract foreign students to fill these seats. Foreign students typically pay fixed out-of-state tuition and fees and are an important source of revenues for universities. This source of funding has been increasingly important in the context of decreasing public support for higher education funding in the last two decades. These fees and tuition rates are fairly rigid and market adjustment tends to be with “quantities” (i.e., the number of students purchasing education services) rather than price. Branding takes place with geography, popularity of sport teams and prestige of the university. Many OECD universities have recruiters in Asian markets.
In the following paragraphs, we review the determinants of bilateral flows of foreign students coming to OECD countries, using our recent study. We then look at what has happened during the pandemic and after, in the United States, the largest of these markets for higher education. We then dive into the situation at the University of Nebraska-Lincoln (UNL), the largest provider of higher-education services in Nebraska. We draw implications at three levels (institution, state, and national).
Using pre-COVID-19 panel data from the OECD, we looked at the determinants of bilateral exports of higher education services between OECD countries and Asia. Their approach treats higher education consumption by Asian countries as a consumable durable good. Foreign students invest in their professional future by improving their human capital, traveling to OECD countries to obtain degrees from their universities. The authors found that bilateral flows of students are strongly influenced by labor earnings in the host country, bilateral distance between their country and the country where they study, the average per capita income of the importer, demographics as captured by college age population, the existence of a common language between the importer and exporter, the visa regime prevailing between the two countries, and the network of migrants from the importing country into the supplying country. Surprisingly, they found no evidence of a country’s universities’ reputation explaining the flow of students. Using more granular data at the university level would qualify this result.
The authors then decomposed the evolution of higher education exports over time, determined by changes in education capacity, labor earnings, visa regimes, migrant networks, income growth in the importing country and changes in college-age population in importing countries for a few selected countries. The decomposition explained very well the emergence of Australia, Canada, Korea, and New Zealand as important exporters of higher education. The decomposition also explains the loss of market share by the United States. Nevertheless, the United States still dominates international trade in higher education services because of its sheer size.
Table 1 shows the decomposition of changes for China’s imports of higher education from selected exporters including the US between 2004 and 2016. China is historically the largest export market. The decomposition over time includes time-varying variables. Distance and networks do not exhibit time variation and cannot be part of this decomposition. The change in visa regimes between China and the various export sources had the largest effects, followed by income growth in China. It is interesting to note the decline of college-age population which has been more accentuated in more recent years.
The Covid variable
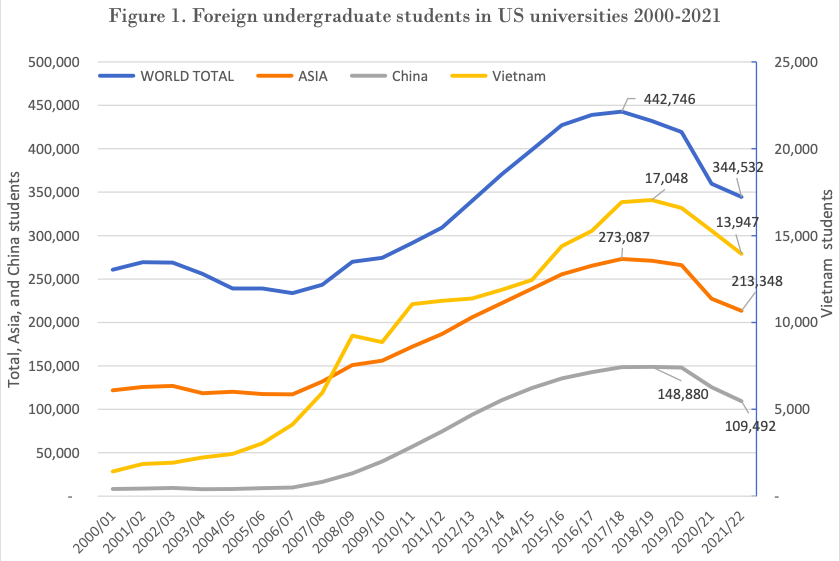
As these patterns were established before the pandemic it is instructive to investigate what happened during the pandemic and after. Asian markets, in particular China, have been maturing as suggested by Figure 1. Figure 1 shows foreign undergraduate enrollment data in US universities since 2000 and up to 2021/22. The data are from the Institute of International Education. There is some smoothing happening naturally because, once in the United States, foreign students remain for several years. The rate of growth of the number of Asian and Chinese students coming to the United States has been decreasing and eventually turned negative as shown in Figure 1 after 2017/18. In 2021-22 the number of Chinese undergraduate students was down to 109,492 students from the peak of 148,880 in 2017/18. The aggregate Asian undergraduate numbers follow a similar pattern peaking at 273,087 and decreasing to 213,348 students.
What has happened in most recent years? The pandemic froze access to OECD countries for new students with physical difficulties to travel, including reduced air travel, closed borders, and difficulties to obtain proper visas. Our analysis has shown that varying visa regimes have very large effects on bilateral flows of foreign students. Several factors contributed: the pandemics, the great difficulty to obtain visas, the secular decline in college-age population and the income shock during Covid. The anti-China rhetoric and trade tensions since 2017 have allegedly also played a role, but this is not quantified here.
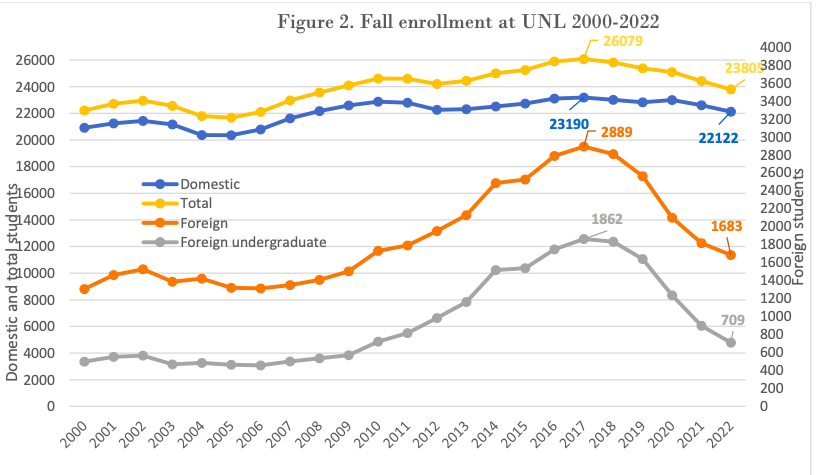
Figure 2 and Table 2 show what has happened at UNL. As UNL is the largest provider of higher education services to foreign students in Nebraska, UNL is an illustrative case study in understanding Nebraska exports of higher education services. Prior to 2010, UNL did not depend much on foreign undergraduate students. Then the number of foreign undergraduate students grew to peak at 1,862 students in 2017-18. At that point foreign undergraduates represented more than 7% of total enrollment at UNL. Before the pandemic foreign enrollment started decreasing and then took a turn for the worse during the pandemic. In 2022, the year-to-year decrease tapered. Foreign undergraduate students are now about 38% of the peak enrollment of 2017-18. Table 2 shows data by country of origin from UNL’s International Student & Scholar Office. The data slightly undercount the total foreign undergraduate enrollment but provide useful insights on the country of origin. The largest drop in undergraduate enrollment came from China, from 591 students to 143 students. The noticeable decrease in Rwandan students coincides with the end of the special program to train Rwandan students in agricultural sciences. It is also interesting to note that the graduate population at UNL has remained very stable, around 900 to 1000 foreign students. This can be seen in Figure 2, as the vertical distance between the foreign student and foreign undergraduate enrollment curves. The stable enrollment of Vietnamese students shown in Table 2 is the exception to the trend of declining foreign undergraduate enrollment.
In conclusion, the export market for higher education services looked like a success story in OECD countries, pre-2017. Using the United States as a case study, we show that foreign enrollment peaked in 2017-18 and then was deeply and negatively affected by the pandemic and its aftermath, and by associated policies which discouraged international mobility of foreign students. On the state level, UNL’s foreign undergraduate enrollment has receded to its lower levels, circa 2010. As domestic enrollment has declined in the last two years, this is a lost opportunity to capture lost revenue, especially in some markets like Malaysia, where UNL had successfully recruited students before the pandemic . Only the future will tell if pre-2018 foreign enrollment can be recovered over time.
Opinions expressed are solely those of the authors and not the Yeutter Institute or the University of Nebraska-Lincoln.
For further reading
Beghin, J., & Park, B. (2022). The exports of higher education services from OECD countries to Asian countries: A gravity approach. The World Economy, 45(4), 1050-1080.
Institute for International Education. Open door factsheets (Nebraska and China 2022).

Beghin is the Mike Yanney Yeutter Institute Chair and a Professor in the Department of Agricultural Economics at the College of Agricultural Sciences and Natural Resources. View Biography

Park is an Associate Research Fellow at the Korea Institute for Industrial Economics & Trade (KIET). View Biography